In November 2014, the city of Berkeley passed Measure D, a tax intended to improve the health of Berkeley residents by reducing their consumption of sugar-sweetened beverages (SSBs) and funding community gardening and nutrition programs. The ordinance levied a cent-per-fluid-ounce tax on distributors, such as stores and restaurants, that buy SSBs from manufacturers and sell them to consumers. Berkeley residents voted for the so-called “soda tax” despite a multimillion-dollar campaign funded by the American Beverage Association (ABA), a lobbying group that represents Coca-Cola and PepsiCo. Whereas proponents of Measure D focused on the negative health consequences of excessive sugar consumption, the ABA argued that the tax would harm small business people and consumers. Today, the tax continues to draw intense scrutiny. Within the past year, two separate research groups with ties to UC Berkeley published studies on SSB consumption in the wake of the bill’s enactment. Both studies showed that SSB consumption among Berkeley consumers dropped as a direct consequence of Measure D, but the two groups drew different conclusions about the mechanism behind this decline.
In the more recently published study, Kristine Madsen from the UC Berkeley School of Public Health led a team that administered questionnaires annually between 2014 and 2017 to passersby at heavily trafficked intersections in two demographically diverse neighborhoods per city in Berkeley, San Francisco, and Oakland. They asked participants how often they consumed SSBs and water on a daily basis. Over the timespan included in the study, Berkeley SSB consumption declined by 52.3 percent, and Berkeley water consumption increased by 25.3 percent. There were no significant changes in consumption in San Francisco or Oakland, neither of which passed soda taxes before 2016.
Madsen’s team also noticed that the decline in SSB consumption in Berkeley doubled from 2015 to 2016 but stayed constant between 2016 and 2017. Because Measure D levied the tax against distributors, consumers only saw increases in SSB prices after the distributors raised their retail prices to compensate for their reduced revenue. Berkeley retailers gradually raised their prices in 2015, so Madsen’s team reasoned that the consumers in their study did not see the full effect of the tax until 2016, at which point consumers appeared to change their SSB consumption in direct response to changes in SSB prices.
A study published four months before Madsen’s drew a different conclusion. Scott Kaplan and Sofia B. Villas-Boas from UC Berkeley’s Department of Agricultural and Resource Economics were part of a team that obtained monthly records of the quantity of different beverages sold at UC Berkeley campus dining locations between January 2013 and December 2016. Whereas Madsen’s team did not have definitive information on when their subjects saw SSB prices change, the University disclosed exactly when its dining locations raised the prices on their SSB products. Kaplan, Villas-Boas, and the rest of the team found that there was not a significant decline in regular soda purchases after campus dining locations raised their prices in August 2016, but when they looked further back in time, they found that purchases had already decreased between July 2014 and July 2016. There was an apparent decrease in soda consumption on campus, but price increases might not have been the mechanism behind the decline.
Instead, Kaplan and Villas-Boas argue that a combination of increased exposure to information and perceived social pressures led consumers to reduce their SSB consumption. Before Measure D appeared on the ballot in November 2015, both the ABA and public health officials campaigned separately for voters. Whereas the ABA argued that small retailers would lose their businesses if the tax passed, public health officials discussed the negative health consequences of the excessive consumption of sugar in SSBs. As Berkeley residents were increasingly confronted with information about SSBs, they became more attuned to external perceptions of their consumption choices. “There’s a social-norms situation where people are like, ‘Well, everyone around me thinks we should be taxing [SSBs], so maybe I should stop drinking,’” says Kaplan.
The team found further support for their theory when they considered diet soda purchases on UC Berkeley’s campus. Even though Measure D specifically targets beverages sweetened with sugars, UC Berkeley uniformly raised prices on all of its soda products, including low-calorie diet drinks with non-sugar sweeteners. If consumers were reducing their consumption of soda based solely on price increases, then it would stand to reason that purchases of diet soda on campus should have declined by the same amount as purchases of regular soda. However, campus consumers appeared to substitute diet soda for regular soda. Such behavior can only be explained by changing attitudes towards sugar consumption.
Despite the different conclusions that they draw, the two studies seem to complement each other. Whereas Kaplan and Villas-Boas published results drawn from SSB sales on a college campus, Madsen’s team made a concerted effort to include demographically diverse consumers in their study. A five-cent increase on the price of soda is a more serious deterrent for people who support themselves entirely at or below minimum wages—the same group of people who are least likely to be able to afford healthcare for obesity-related health issues. Taken together, these studies suggest that there is no single strategy that public health officials can implement to encourage healthier choices among all citizens. The factors that go into making a decision can vary widely from individual to individual, so an effective public health effort requires a multipronged approach. The massive information campaign triggered by the ABA’s efforts to kill Measure D appears to have ultimately made it stronger.
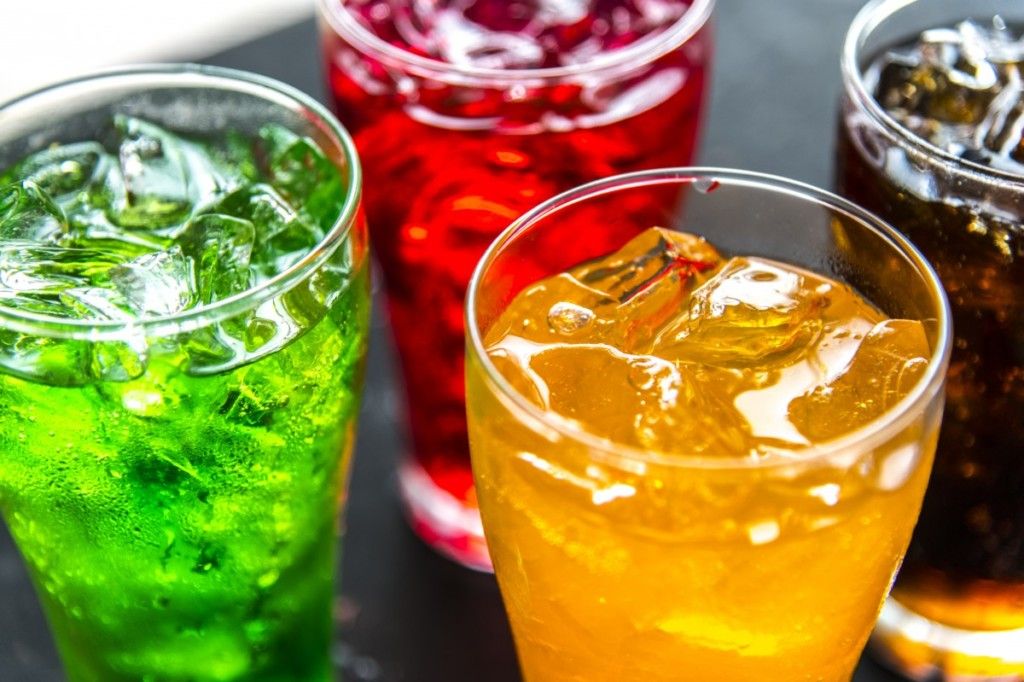
Featured image of colorful soda.


