You’ll have to go up alone,” the custodian tells me. “My back gave out years ago, so I don’t do ladders anymore.”
We’re standing in the broom closet of Fred T. Korematsu Discovery Academy in Oakland, California, one of a dozen schools I’ve visited in as many months to check on my sensors. Like in many elementary schools, the Korematsu Academy broom closet houses the ladder to the roof, where a little automated instrument I built is busily measuring atmospheric carbon dioxide, or CO2.
CO2 gushes into the air and sea from tailpipes and smokestacks around the industrialized world, where it subsequently causes global warming and acidifies the oceans. As the international community begins to create resolutions to cut back CO2 emissions, we at the BErkeley Atmospheric CO2 Observation Network (or “BEACO2N,” conceived by my advisor Professor Ron Cohen of the chemistry department) are investigating new ways to monitor urban CO2 in hopes of reducing emissions as efficiently as possible. It’s a lofty goal that involves a lot of broom closets.
Shimmying around a mop bucket and a lifetime supply of hand soap, I climb the ladder alone as instructed, which is just as well. Atmospheric monitoring equipment can be finicky, and it might be months before my next visit. It’ll take my full concentration to make sure everything is squared away.
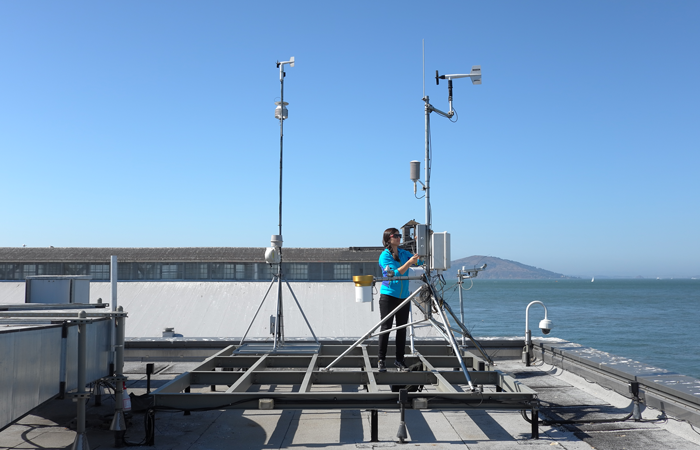 Alexis Shusterman performs maintenance on a rooftop carbon dioxide sensor at San Francisco's Exploratorium. Credit: Michael Wan
Once on the roof, I approach the little metal shoebox that houses my sensor and gingerly pry it open. Out of 30 sensors, this is one of my oldest units: it’s been collecting data since 2012. Clamped and double-clamped to the railing that encircles the roof, the sensor is designed to weather high winds, blistering sun, and pounding rain—but the electronics inside are delicate, and sometimes things go wrong. I wire up a portable readout screen and relax a little. A quick scan through the data suggests that everything is working properly. The global background CO2 concentration is about 400 parts per million (0.04 percent) these days, but here in Oakland, in the relatively isolated bubble of air that accumulates the city’s greenhouse gas emissions, I’m unfazed by values above 600 parts per million.
These super-high spikes in CO2 will eventually leave the “urban dome” and mix into the free troposphere between 100 and 1,000 meters above ground, entering a much larger volume of air where these CO2 plumes are diluted to lower concentrations. If we monitor CO2 within the urban dome before the gas becomes too dilute, we can pinpoint exactly where the plumes are coming from. It’s much easier to attribute a given CO2 spike to a specific freeway if your sensor is right next to it than if it’s 200 miles downwind.
As I jot down some notes, a frustrated commuter leans on his horn, drawing my attention to the growing queue of brake lights on the nearby highway. In the distance, the jagged San Francisco skyline stews in its usual haze. Spending day after day installing gas sensors has a way of making the invisible visible. Over time, I’ve found it harder to look out over a landscape without seeing our unhappy legacy to future generations in every high-rise, tailpipe, and train track. I allow myself a despondent sigh, then turn back to my work.
While the BEACO2N approach might sound straightforward, it’s a far cry from how CO2 has traditionally been monitored. CO2 can be difficult (and pricey) to detect with accuracy. The best CO2 sensors are big, expensive instruments with big, expensive maintenance regimens. To get the most bang for their buck, research institutions like the National Oceanic and Atmospheric Administration (NOAA) position the few CO2 instruments they can afford on top of mountains and tall towers, where natural air currents ensure that the instrument accesses well-mixed, average CO2 concentrations that are representative of the region as a whole.
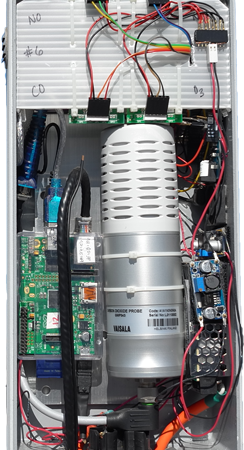 Low-cost instruments and custom-made electronics make it possible to deploy more sensors than ever before. Credit: Micahel Wan
Here in Berkeley, we’re lucky enough to have one of these superstar sensors in our own backyard, clinging intrepidly to the three-legged Mount Sutro cell tower in San Francisco, dutifully sniffing the air for CO2. From up on high, the Sutro Tower instrument gives scientists valuable, state-of-the-art measurements of the average CO2 concentrations in the Bay Area. But it can’t provide information about the street-by-street, house-by-house emissions down below, the very emissions that climate change regulations aim to address. We will need some other way to keep track of surface-level emissions once the regulations go into effect.
That’s why my team is sniffing the air too, but we’re doing it a little less James Bond and a little more MacGyver. Instead of a single, gleaming flagship instrument, we’ve hacked together dozens of homemade foot soldiers and embedded them on rooftops of schools and museums across the Bay Area. These sites provide about the right spatial density—roughly one mile between sensors—plus a natural platform for our outreach efforts, explaining climate change research to the next generation of scientists and engineers.
From my rooftop perch, I can see a few of the other schools where my sensors are stationed. Unlike the lonely Sutro Tower instrument, my sensors are more powerful together than they are alone. One sensor might show a CO2 plume, but a grid of sensors can triangulate where that plume is coming from. Sure, the numbers from our homespun contraptions aren’t quite as clean—there aren’t as many digits after the decimal point and the values jump around more—but we’re betting there is some value to our ugly duckling dataset nonetheless.
Once I climb down and head back to the lab, I will be able to download and crunch the data more quantitatively. In my analyses, I’ll look for the telltale signs of urban life, like the distinct peak in CO2 concentrations right around the morning rush hour, or the unique chemical fingerprint of burned diesel fuel that tells me semi trucks were nearby. When the truck drivers go on strike, or just on break for the weekend, their special chemical signature disappears.
Using mathematical models based on such events, we have a shot at discerning what fraction of a CO2 plume is coming from different types of vehicles. Combined with our information on the precise location of the plumes, our sensor network may one day help lawmakers better target their regulation of vehicle emissions and, later, assess whether those regulations are functioning as intended.
My aspirational musings are interrupted by someone calling: “Miss! Miss!” I look down to see a mob of fourth graders, eagerly waving my way from the playground. “Pelotas! Pelotas!” they’re chanting.
At the roof’s edge, I find a flock of marooned dodgeballs, soccer balls, and basketballs, some sporting patches of moss or lichen. I toss the balls one by one into the students’ open arms, earning whoops of appreciation as each child sprints away with her prize.
We are leaving this next generation an inheritance of warming and pollution; I want to also leave them with the best technology we’ve got. Surveying my domain, I imagine my little army of sensors blinking cordially at one another as they tack another line onto their endless stream of data. I give a deflated kickball a final lob.
“Gracias, ball lady!” the last student calls, and disappears.
This article is part of the Fall 2016 issue.